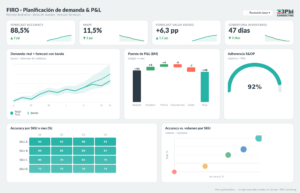
The dashboard shows what you already knew. The new question is still waiting
Your team has dashboards. Good ones, probably. Sales by region, margin by product line, month-over-month trends. You built them thoughtfully, you review them in the weekly meeting, and they’re the starting point for almost every management conversation.
But Monday came around and the sales manager asked: “Why did the North region’s margin drop this month?”
There’s no visual for that. The dashboard shows the what — margin dropped — not the why. To answer that question, someone has to open Power BI Desktop, join tables, filter by region and month, and come back with an analysis. If the analyst is available, the answer arrives in hours. If not, it arrives on Friday.
That gap — between the question that comes up and the answer that arrives — is the real cost of depending on an analyst for every new query. It’s not a technical problem. It’s a data access problem.
This is where natural language comes in.
What it means to ask your data questions in natural language
Asking in natural language is exactly what it sounds like: typing a question the way you’d write it in a chat, and having the system understand it, translate it into the data model, and return an answer.
It’s not searching in a search engine. It’s not filtering a dashboard. It’s a conversation with your information.
“How are North region sales tracking this month compared to the same period last year?”
“Which product dropped margin the most in May?”
“Which are the three branches with the largest variance against budget?”
Questions any leader would ask in a meeting. Questions that today turn into a ticket for the analyst.
The difference between doing this well and doing it poorly lies in the layer that processes the question. A generic system returns an isolated data point. A system properly implemented on top of your data model returns the answer explained, with the source, with your business context. That’s what makes the answer actionable rather than merely informative.
How Chat with your BI works
Chat with your BI is 3PBI’s conversational solution built on top of your existing Power BI model. It doesn’t replace your dashboards: it extends them with a conversation layer.
Here’s how it works:
1. It connects to your Power BI model. The data doesn’t move. The system queries the same semantic model you already use, with the same business rules you already defined.
2. It enforces role-based security. Each user sees exactly what they’re entitled to see. A regional manager queries their region; leadership can see everything. Security isn’t configured all over again: it inherits from the model.
3. It understands the context of your industry and your business. It knows that “North” is a sales region, that “margin” in your company is calculated with a specific formula, that “current month” runs from the 1st through today. That context isn’t something a generic AI model learns on its own: we configure it during implementation.
4. It returns explainable answers, with the source. No black box. Every answer shows where the data comes from, what period it covers, what filters were applied. Users know exactly what the answer is based on.
A concrete example
It’s 9:15 on a Tuesday morning. The sales manager types in the chat:
“How are North region sales tracking this month?”
Within seconds she gets:
“The North region has accumulated $4.2M in sales as of June 27, 8% below the same period last year ($4.6M). The variance is concentrated in product line X, which fell 22% vs. June 2025. The other lines are within range. Source: Power BI model · Sales table · refreshed: today 08:00.”
She didn’t call the analyst. She didn’t open Power BI. She didn’t build a filter. She got the answer, the source, and the data point that explains it — all in the same message.
Chat with your BI vs. Copilot for Power BI
Copilot for Power BI is a good product. Microsoft has been developing it aggressively, and by 2026 it already covers important use cases: summarizing report pages, generating visualizations from a natural language description, answering questions about the semantic model you have open, and creating full reports from scratch with a prompt. For anyone building reports or exploring a model, it’s a valuable tool within the Microsoft ecosystem.
The difference isn’t about quality: it’s about focus and audience.
| Copilot for Power BI | Chat with your BI | |
|---|---|---|
| Intended user | Analysts and report builders | The whole team: sales, operations, finance |
| What it does best | Building reports, generating visuals, summarizing pages | Answering management questions in natural language |
| Scope | Within the report or model open in Power BI | On your model, with configured business context |
| Business context | Depends on what the model already contains | Configured specifically: rules, terminology, industry |
| Role-based security | Inherits the model’s Row-Level Security | Inherits it + an additional governance layer |
| Explainability | Shows the generated visual | Shows the answer + the source + the filters applied |
| Requires Power BI skills | Yes, to unlock its full potential | No: any user can ask from a chat |
| Licensing | Fabric / Power BI capacity, per Microsoft’s current plans | Based on the agreed implementation |
When does each one make sense?
Copilot for Power BI is the right tool when the goal is to build or explore: putting together a quick new report, generating a visualization that doesn’t exist yet, or letting an analyst interrogate the semantic model from within Power BI. If your data team already lives in the Microsoft ecosystem and wants to speed up report creation, Copilot is the natural path.
Chat with your BI is the right tool when the goal is to answer: the manager asking about margin, the branch lead who wants to know how their numbers are tracking, the sales team that doesn’t know — and doesn’t need to know — what DAX is. It’s the layer that turns the dashboards you already have into a resource the whole organization can access, not just the people who know how to use them.
They’re not mutually exclusive. In many organizations, the analyst uses Copilot to build and the business team uses Chat with your BI to ask. Two tools, two audiences, one data model.
Questions your team already wants to ask
After more than 15 years and more than 24 clients across industries like energy, agribusiness, retail, healthcare and manufacturing, we see that the most frequent questions are variations of these:
Sales
- “How much did we sell this week vs. last week?”
- “Which sales rep is furthest from budget?”
- “Which are the 5 customers with the biggest revenue drop this quarter?”
Operations / Manufacturing
- “What’s the average OEE for line 3 in June?”
- “Which shift has the highest reject rate this month?”
Finance
- “How did gross margin close for the month vs. budget?”
- “Which cost center has the largest year-to-date variance?”
Leadership
- “Give me a three-point summary of the quarter’s sales performance.”
- “Which region hit its target and which didn’t?”
None of those questions require the person asking to know how to open Power BI. They require the data to be in good shape and the system to understand the business.
What it takes to make it work well
Here comes the part few conversational AI implementations explain honestly: the results you get from “Chat with your BI” depend directly on the quality of what’s underneath. There are no shortcuts.
Clean data. If the source data has inconsistencies — region names with variant spellings, badly entered dates, duplicates — the answers will be just as inconsistent as the data. Cleanup isn’t optional.
A well-built semantic model. The Power BI model has to be thoughtfully designed: metrics calculated correctly, relationships properly defined, hierarchies that follow the logic of the business. A rushed model produces wrong answers even if the natural language system is excellent.
Documented business context. “North”, “margin”, “current month”, “target”: each term has a specific meaning in your company. That glossary is configured during implementation so the system answers with your business logic, not the generic logic of an AI model.
Governance and roles. Who can ask what, which data each role sees, which questions are in scope. That isn’t improvised: it’s designed.
At 3PBI we start with the diagnosis: first we understand which decisions the system needs to enable, then we build. That’s the difference between an implementation that works on day one and one that generates answers nobody trusts.
Your team can have the answer before the meeting ends
Dashboards aren’t going away. They’ll remain the point of reference, the consolidated view, the control panel. But the new question — the one that comes up in the meeting, the one without a dedicated visual — shouldn’t have to wait for the analyst.
With Chat with your BI, anyone on the team can ask, get the answer with its source, and keep making decisions. No DAX, no filters, no tickets.
If you want to see how it works on your model and your business, request a demo. In 30 minutes we’ll walk you through the full flow with real data.
Interested in exploring other pillars of data-driven decision making? Also read:
- Sales forecasting: when Excel is no longer enough and what to do about it
- Manufacturing KPIs: how to build a management dashboard people actually use
What the data says
- Microsoft documents that Copilot enables creating reports and querying the semantic model in natural language, and that the classic Q&A experience will be retired in December 2026 in favor of Copilot. (Microsoft Learn – Copilot in Power BI)
Sources and references
- Microsoft Learn — Copilot for Power BI (overview)
- Microsoft Learn — Explore data with Power BI Q&A (natural language)
- Microsoft Learn — Use Copilot with semantic models
Sources consulted in June 2026. Data shown in the sample dashboards is illustrative.