Spreadsheets are everywhere. In Finance. In Sales. In Logistics. Every department has its own version of the forecast, its own scenario tab, its own price table. And when month-end close arrives, the ritual begins: comparing files, requesting the latest version by email, discovering that someone overwrote the May column.
It’s not a people problem. It’s a tooling problem.
Excel is extraordinary for exploring data. But for governing a sales planning process with multiple versions, roles and approvals, it falls short. Not because it’s old — because it was never designed for that.
This article explains why spreadsheet-based forecasting hits its limit, what an S&OP process actually is, and what a platform needs in order to make it work in your organization.
Why planning on spreadsheets breaks down
There isn’t a single point of failure. There are five, and they compound.
1. Fragmented information
Sales has its revenue estimate. Finance has another one, adjusted to budget. Logistics works from a third number to plan inventory. Each team reasons in good faith from its own spreadsheet. The problem is that those three versions never converge in one place. When a decision has to be made — order an extra batch, shut down a channel, review the price of a SKU — every department defends its own number and nobody can prove which one is right.
2. Zero traceability
Why did the June forecast change between the version from the 5th and the one from the 19th? There’s no way to know. There’s no record of who changed which cell, based on what criteria, or whether that correction was ever approved by anyone. The file simply shows a different number. When an audit comes around — or when actual results diverge sharply from the projection — reconstructing the history is nearly impossible.
3. Informal sign-offs by email
“Can you confirm the August number for the pharma channel?” “Yes, looks good to me.” That email exchange is the approval workflow. There’s no cell locking after approval, no record of who signed off, no timestamp. If something goes wrong, the debate starts from scratch.
4. No real version control
Naming a file “v2_FINAL_ok_DEFINITIVE.xlsx” isn’t versioning. It’s noise. In a real planning process, versions coexist with a purpose: the annual Budget, the monthly Forecast, the operational plan Logistics runs on, the ad-hoc scenarios for a pricing negotiation. Each one has its own logic and its own lifespan. In spreadsheets, all of that gets managed through file names and shared folders. Confusion is inevitable.
5. The P&L only shows up at close
The most expensive consequence: during the planning process, nobody sees the financial impact in real time. The sales team estimates units. Finance converts them to currency, applies margins, deducts discounts, taxes, logistics costs. That result appears weeks later, when it’s too late to adjust. If the projected margin doesn’t add up, the spreadsheet has already been (informally) approved — and changing it means starting all over again.
What S&OP actually is
Sales & Operations Planning is the monthly process that aligns three conversations that usually happen in isolation: how much the sales team expects to sell, how much operations can produce or supply, and how much finance needs to earn.
It’s not a piece of software. It’s a process with meetings, roles, horizons and decisions. What software does is structure it and make it governable.
In practice, a well-built S&OP cycle includes:
- Planning horizon: between 18 and 36 months, reviewed monthly. You don’t just plan the next month; you update the medium-term projection.
- Versions with a purpose: the Budget is the annual commitment, the Forecast is the revised projection, the operational plan is what Logistics and Production execute. They are not the same thing and shouldn’t live in the same file.
- Clear roles: Finance shouldn’t be able to modify the Sales forecast without a process. Logistics needs to see the approved number, not the draft. The CEO approves the final scenario. Every role has its moment and its responsibility.
- On-demand financial impact: as the forecast is being built, the team needs to see Net Sales, margin and costs in real time — not wait until close.
This isn’t just for large enterprises. It’s relevant for any organization that plans demand with more than two people involved.
5 signs your Excel forecast is no longer enough
You don’t need a crisis to recognize it. These situations are enough:
-
You spend more time consolidating than analyzing. If the planning meeting starts with 30 minutes of “does anyone have the final version?”, the process is broken before it begins.
-
The number the CEO approved has already changed before it reaches operations. Without locking and traceability, no approval is ever final.
-
You can’t compare the current Forecast against the January Budget without building a new table. If comparing versions requires manual work, your versions aren’t governed.
-
Finance finds out about the margin impact after the forecast is already locked. If the P&L arrives late, it arrives broken.
-
Every “what-if” scenario means duplicating a file. If simulating the impact of a 10% drop in one channel requires making a copy of the Excel file, you don’t have scenarios — you have orphaned files.
If two or more of these sound familiar, the bottleneck isn’t your team’s dedication. It’s the tool.
What to look for in an S&OP platform
When you evaluate options, these are the criteria that actually matter.
Versions with purpose and control
The platform must support different forecast versions — Budget, monthly Forecast, operational plan, ad-hoc scenarios — each with its own lifecycle and rules. Being able to create tabs isn’t enough. There has to be post-approval locking and a change audit trail.
FIRO works with named versions (Budget, Forecast, operational plan, ad-hoc), each of which can hold up to 10 scenarios. You can copy and paste from Excel to load data, but once the approval workflow moves forward, the version is locked.
On-demand P&L, down to SKU and channel level
The impact on Net Sales, margin and costs must be available while the forecast is being built, not at the end. And it has to drill down to the level of detail the business needs: product, channel, month.
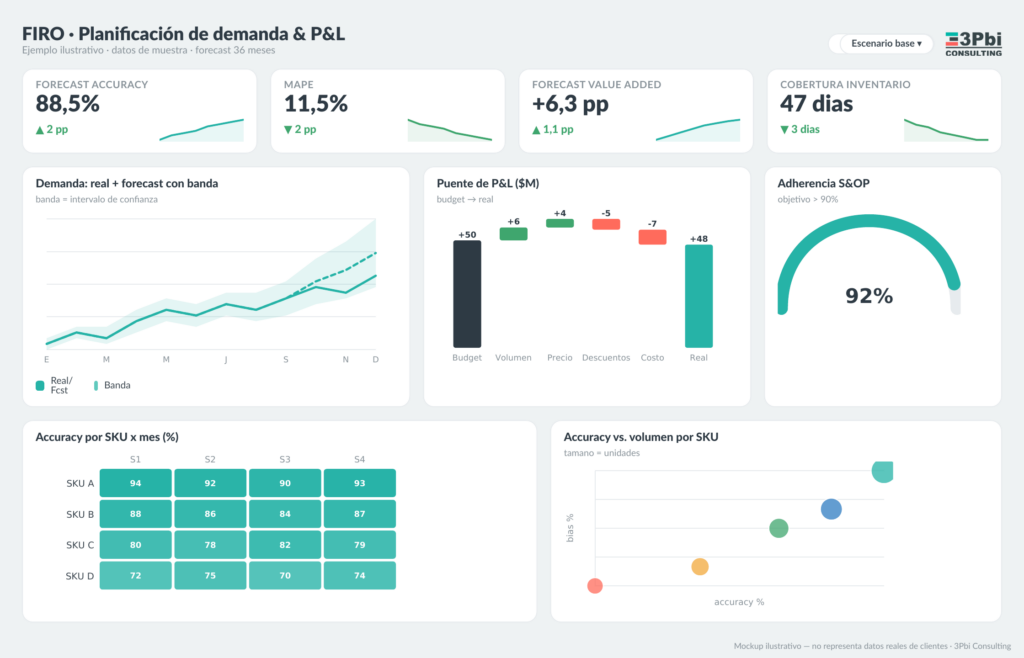
FIRO’s P&L Dashboard translates the forecast into financial results in real time — Net Sales, margin, comparison against actuals and against previous versions — with no need to export or cross-reference files.
Role-based approval workflow
“Everyone on the team can edit” isn’t enough. An S&OP process has roles: whoever builds the forecast, whoever reviews it technically, whoever approves it commercially, whoever validates it from finance, whoever gives final sign-off. Each role has its step and its moment.
FIRO implements an 8-step workflow with defined roles: Finance, Product Manager, Business Unit Director, Logistics, Pricing, CEO. When one step is approved, the next one unlocks. There is no way to skip the process.
Structured multi-scenario planning
Scenarios need to be comparable against each other, not just exist. What happens if the modern trade channel drops 15%? What if the exchange rate moves? What if we launch the new SKU in July instead of September? Those questions have to be answerable without building new files.
Integrated BI for analysis
The forecast is the input; the analysis is what matters. An S&OP platform must be able to connect to your BI layer — like Power BI — so that management dashboards reflect the approved forecast and let you compare it against actuals.
AI that audits, not replaces
Artificial intelligence in planning has a useful, concrete role: spotting what the team can’t see. Anomalies in the historical series, drops in forecast accuracy by SKU or channel, out-of-range patterns. That’s auditing, not automated planning.
FIRO includes an AI module that analyzes forecast accuracy and detects anomalies, but it doesn’t generate projections without human review. The team is still the one making the calls. The AI points out where to look.
What the transition looks like
One of the most common blockers to adopting an S&OP platform is the fear of losing the knowledge that lives inside the spreadsheets: the formulas someone built over years, the manual adjustments that make business sense even if they aren’t obvious to an outsider.
The transition doesn’t have to be an abrupt replacement. FIRO is designed for progressive adoption in three steps:
Step 1 — Load with what you already have. The input grid is editable month by month, by product, channel and version, and it accepts copy-paste from Excel. You don’t need to migrate everything on day one: you can start with one period, one channel or one version.
Step 2 — Turn on the workflow. Once the team is comfortable with the grid, the approval steps go live. The process gains traceability and locking without radically changing the way the team works.
Step 3 — Enable scenarios and the P&L. With the core process running, you add the simulation capabilities and the financial dashboard. That’s where the planning process stops being administrative and becomes strategic.
This path applies to consumer goods and distribution companies just as much as to healthcare and industrial businesses. S&OP doesn’t change from one industry to another; what changes are the master data and the business drivers.
The forecast that matters isn’t in the file; it’s in the process
After more than 15 years working with planning teams at companies like Bagó, AbbVie, Pan American Energy and Acciona, we see the same pattern: the problem isn’t a lack of data. It’s that the data lives in files nobody controls, with versions nobody can compare, approved through an email nobody remembers.
A governed S&OP process doesn’t make planning perfect. It makes errors visible, keeps decisions on the record, and lets the team learn from one cycle to the next.
That’s the starting point.
Want to see what this looks like in practice?
Meet FIRO — 3PBI’s S&OP and sales planning platform — and book a demo with the team. In 30 minutes you can see the full workflow applied to your industry.
If you found this article useful, you may also be interested in:
- Manufacturing KPIs: how to build a management dashboard people actually use
- Chat with your BI: query your data in natural language with Copilot
What the data says
- Field audits find errors in 86–94% of corporate spreadsheets, and their authors tend to overestimate their accuracy (research by R. Panko and EuSpRIG). (Panko – Spreadsheet Research)
- APICS/ASCM defines S&OP as the process that aligns sales, operations and finance, and standardizes MAPE as the forecast accuracy metric. (ASCM (APICS) – S&OP)
Sources and references
- Panko, R. — “What We Know About Spreadsheet Errors”
- EuSpRIG — European Spreadsheet Risks Interest Group
- ASCM (APICS) — Sales & Operations Planning
- SAP — What Is Sales and Operations Planning (S&OP)?
- Lokad — Sales and Operations Planning
Sources consulted in June 2026. Data shown in the sample dashboards is illustrative.